Explore visualisations

Electrification of Primary Schools 2015
This map visualization shows the county and constituency summaries of electrification status of public primary schools by the Rural Electrification Authority. 17,278 have been connected out of 21,158 targeted public primary schools.
You can also search for your school by name and view if it has been connected or not. The detailed list of primary schools was obtained from Rural Electrification Authority.
View me
County Government Spending 2013-2014
This visualization shows how individual counties implemented their budgets for the financial year 2013/2014. "Annual County Governments Budget Implementation Review Report FY 2013/2014" was the primary data source used in this visualization. This report can be obtained from the Office of the Controller of Budget.
An analysis of expenditure in both arms of government can be viewed alongside the total allocated funds. The Absorption rate represents actual expenditure as a percentage of the approved budget.
View me
Map based UI for finding topo sheets in Kenya
Example of a Frontend user interface to enable users find topo sheets for their various needs. Gridding system currently works for 1:50000 map sheets. Challenged to try this by Kanyingi
View me


Visualising a utility companies' infrastructure
Screenshots showing how a water utility company could visualise and interact with their water metres, pipleline network, resevoirs and leaks data. Built using PostgreSQL, Geoserver, Leaflet and Javascript.
Click on the images to launch slideshow

Organisation of Coffee production in Kenya
Here we show the arrangement of operators responsible for coffee production in various counties in Kenya. This is based on 2016 spreadsheet data. The names of small producers, estates, factories, cooperatives in the value chain are listed for each county.
View me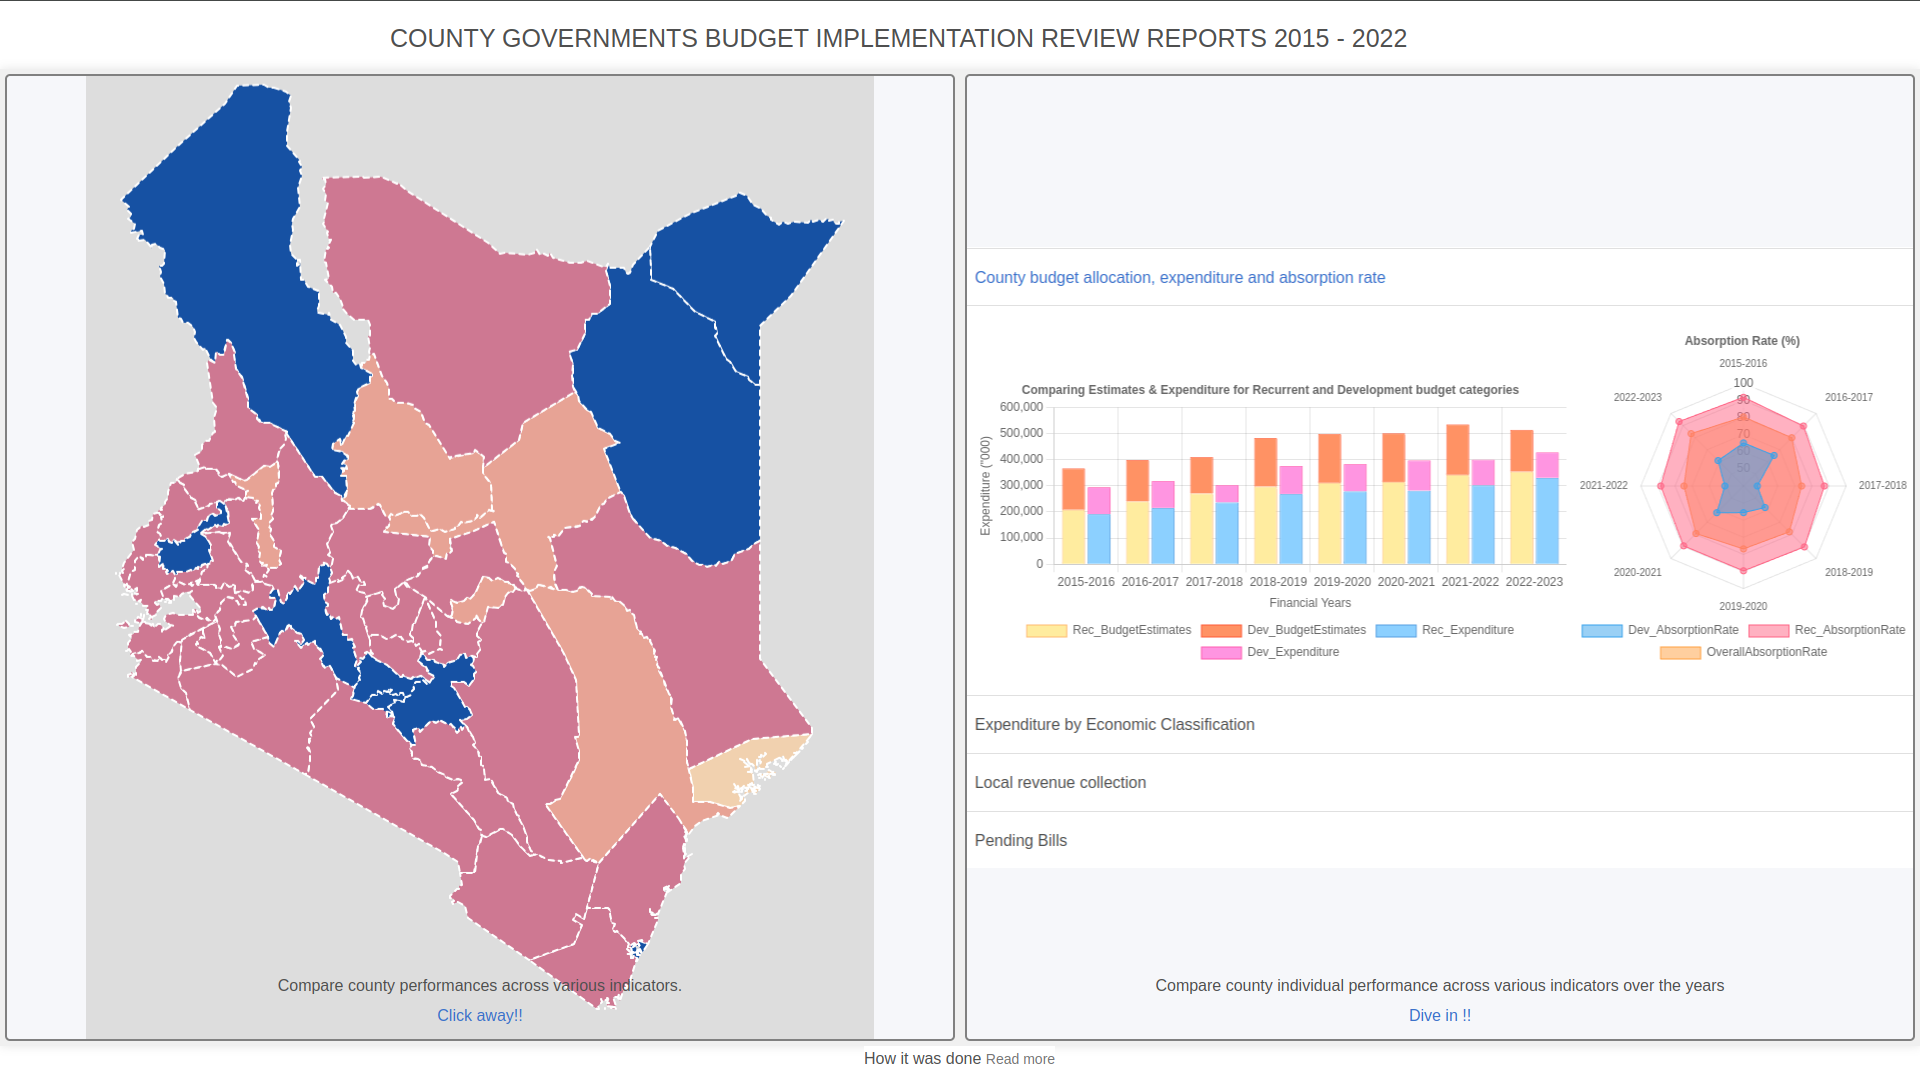
Visualising County Government Spending from 2015 - 2022 in Kenya
This updated visualisation presents an overview of how county governments in Kenya accounted for their budgets starting from 2015 to 2022. Camelot, a python library was used to extract selected tables from large PDF reports. The extracted tables were then cleaned and organised into structured json files used to develop the visualisation (Javascript libraries used are Leaflet, underscorejs and Chartjs).
Data used was sourced from the "Consolidated County Budget Implementation Review Reports " from the Office of the Controller of Budget.
View me